
Technologies in this project:
Website stack: HTML, CSS, JavaScript
Web map library: Leaflet
Data Processing: Java, ASP.Net, SharePoint and Graph API, Azure Storage
The original business goal this project is based on was to take traditional static page products (e.g., PowerPoint, PDF, etc..) used for military intelligence purposes and convert them to interactive web pages. The primary intelligence was MTI (Moving Target Indication) data. You can consider this data to be essentially GPS-style tracks that were captured on moving targets from specialized sensors. This data would help track targets by knowing where they were going and how fast they were going. However, the business goal would have hundreds of thousands of points across hundreds of moving targets during 24/7 operations. Attempting to break down advanced movement and tie it to intelligence was very difficult to do with a singular picture or a few within a slide deck. It was often far more ingestible when you could see the movement and play around with it.
This style of map was made to be programmatically added to a SharePoint backend through some JavaScript and Java/.NET data pipelining. Analysts would only need to input a few items such as a bounding box and the specialized track data that would be converted to .geojson and the rest of the map would be built on known variables and locations. For the sake of a hosted example project that backend hasn’t been replicated. However, it was one of the more interesting projects I enjoyed showing off that made our shop appear to be far more advanced and larger than it was. It allowed the intelligence data to be far more easily understood and really showed the capability of involving time data.
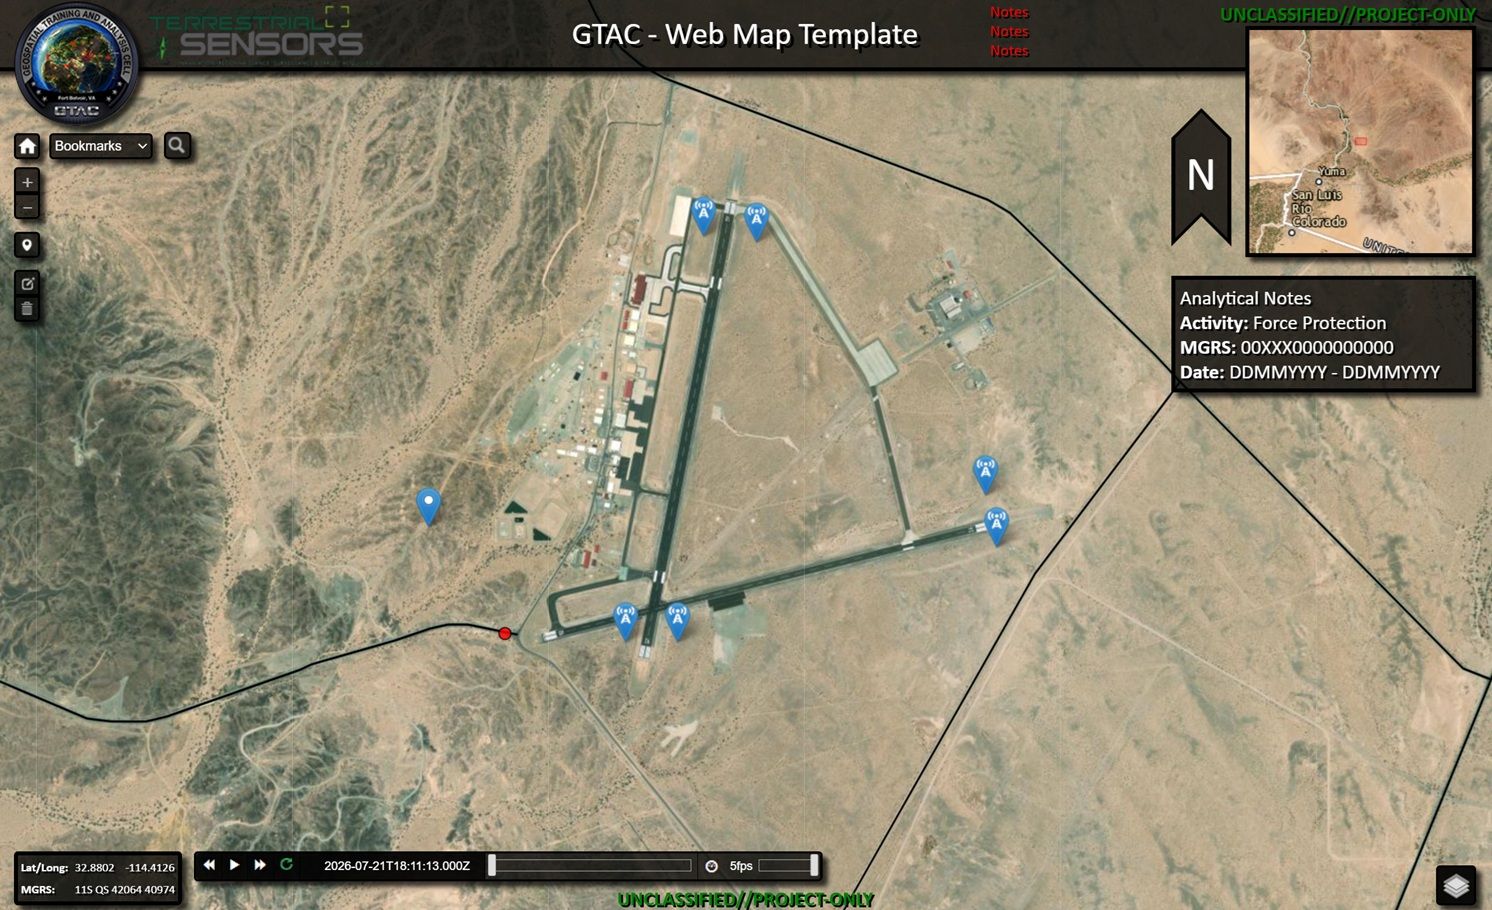
The style, although a bit much now, was to match nearly identically to approved military templates. Obviously interactive web map components wouldn’t need to be loaded on the PowerPoint or PDF products. However, the products could be linked to hosted versions of the web map and downloadable static products. This easily allowed analysts or decision-makers to go in between them for convenience.
Again, these were programmatically made and the analysts primarily needed to only supply an online form:
- The track(s) file(s) that were used or exported for the original products with desktop and digital slidedeck. Multi-file upload.
- A bounding box to ensure the map contents couldn’t accidentally get too far away from the target analysis.
- A few map marginalia copied and pasted from the original product like: title, notes, classification, etc…
The backend would then generate from boilerplate files and templates.
For this post I’ll be focusing primarily on the interactive elements that can help with discovery and intelligence.
All products had standardized branding, coloration, and map marginalia. The online web map version like this project would also have standard layer controls and zooming capabilities. Specially added was:
- A pop-up style wizard for first-time users to get an idea of how to operate this product.
- The ability to get quick coordinants from the bottom right that would follow the cursor.
- The ability to draw and edit basic points. This could help with interactively keeping track of locations of interest temporarily.
- The ability to bookmark certain locations for user focus, usually critical locations the targets passed or stopped by.
- The ability to search any data on the map to include tags. Examples in this project are roads and towers.
- The star of the show is the time controller that would give very granular control of time-based data.
Although there is a large area that could be explored, I generally will just focus on the movement components since time data is fairly involved. You have to consider:
- The time format the original data is in.
- Any conversion, if applicable, to ensure it can meet a schema that can be programmatically controlled.
- Ensure the program variables based on timing will work for data played at normal, reduced, or increased speeds.
- There are various ways to showcase movement. We can show all points on a track as they go but that would cause a lot of confusion with overlapping tracks. Trails could also be made where reduced size and/or transparency could work as well.
- Ensure the controls match the full-time extent of multiple inputs. We need to know that if the user scrubs the bars they keep up and ensure the data shows only the appropriate data based on the current time.
- The ability to click on the time to go between ISO standard and traditional options.
Here is an example of the tracks moving and the ability to draw temporary points to track a “meetup location” where something may have been dropped off in this hypothetical scenario:
Overall it takes a lot to make “movement make sense.” This was a great start for the team and really helped our team stand out and get a lot more out of the data by reducing the time it might take to communicate this intelligence between personnel. You can check out a live example below:
GTAC – Web Map Template
Nerd Stuff
At some point I plan to overhaul this project, but for now I’ll just have a few of the input items highlighted for the few concerns a background process would need to customize the settings. Some of the design choices were to allow for the most supported options on older and none-specialized architecture (SharePoint). Otherwise actually fairly boring stuff for now, but just wanted to explain some of the output considerations. Overall still pretty happy with one of my first zero-to-one solutions.
Currently transfering…